Siddharth Chandra
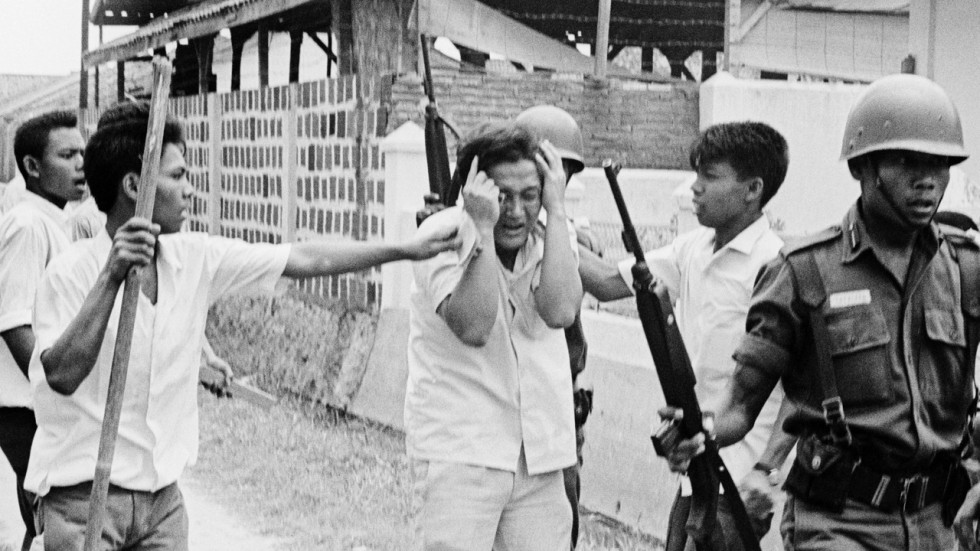
Since the fall of Suharto in 1998, much has been written about the killings associated with the so-called September 30th Movement. A growing body of work has emerged that describes the experiences of the often-innocent people who died or otherwise suffered the injustices of the time. This project is inspired by the work of earlier scholars and of the victims and their family members who, despite overwhelming pressure to remain silent during and even after the New Order, have dared to tell their stories.
Our project is motivated by two premises. First, the magnitude of the killings, estimated at 500,000 people, was large enough that it should be noticeable in demographic data. And second, the presence of censuses from before and after the killings should enable estimates of changes in population associated with the killings across the worst affected provinces. Such an exercise should enable us to confirm many aspects of the events as narrated by those who have written about them. Equally importantly, such a project has the potential to reveal or emphasise important phenomena that may have gone unnoticed in earlier accounts, most of which used sources of information other than census data.
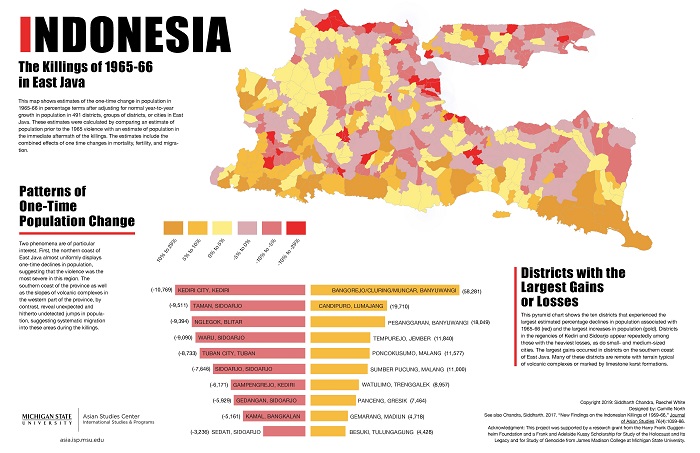
The infographics presented here come with two important caveats. First, the estimates of population change associated with the killings in a few kecamatan (districts) are probably inaccurate because the assumptions underlying the calculations likely do not hold uniformly across all kecamatan.
Second, the estimates cover population change, which is a combination of one-time changes in deaths, migration, and births rather than deaths alone. In an area where the violence was most severe, one would expect changes in all three of these phenomena to add up in the same direction – a violence-prone area is likely to see elevated mortality, increased out-migration and depressed fertility.
These caveats notwithstanding, as the infographics and the underlying research hopefully demonstrates, the patterns that emerge when a province is viewed as a whole are compelling and generally line up with what has been written about the killings. As a consequence, the new phenomena revealed by these exercises are also likely to reflect real, on-the-ground phenomena during this tumultuous period.
Patterns and population
The two infographics presented here focus on East Java where the killings, by all accounts, took a heavy toll. The first infographic is a map of the kecamatan of East Java showing estimated losses in population associated with the killings along with a ranking of the ten kecamatan that experienced the largest one-time losses and gains in population. Readers who are knowledgeable about the killings will immediately recognise a hot-spot for population loss in Kediri.
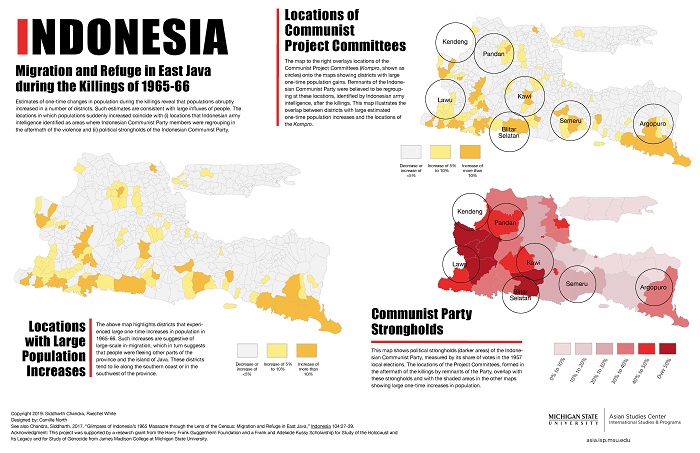
The second infographic, which summarises a paper that appeared in the journal Indonesia, ties the estimates in the first infographic to Operation Trisula, whereby the Indonesian Army ‘crushed’ what remained of the Indonesian Communist Party (PKI) leadership. It shows that kecamatan with gains in population coincided with locations that Indonesian Army intelligence identified as re-grouping locations for the PKI leadership in the aftermath of the killings of 1965-66.
In addition to hints about locations in which the violence may have been particularly pronounced or to which large numbers of refugees may have fled, an important pattern that our calculations revealed was a systematic phenomenon of refuge-seeking in the remote PKI strongholds on the southern shore of East Java.
View the full size infographic
View the full sized infographic
This project titled, 'Geographic Perspectives on the Indonesian Killings of 1965-66 in Central and East Java' is supported by a research grant from the Harry Frank Guggenheim Foundation and a Frank and Adelaide Kussy Scholarship for Study of the Holocaust and Its Legacy and for Study of Genocide from James Madison College at Michigan State University.
Siddharth Chandra (chandr45@msu.edu) is a Professor of economics in the James Madison College at Michigan State University and Director of the university's Asian Studies Center. His research lies at the intersection of Asian Studies, demography, epidemiology, geography, history, and politics. He completed his Ph.D. in Economics with a focus on Indonesia at Cornell University.